
The summer every flush mattered
As Canada warms, research points to greater drought risks and questions about future water supplies.
Catherine Italiano learned to shower in a minute and a half. Laundry went to her children's homes or travelled with her to Montreal. Visitors were asked not to flush the toilet. Men were told to go pee outside.
At her rural home south of Russell the drought of 2025 turned ordinary household routines into calculations about how much water the family could afford to use. The warning came when the household water system repeatedly shut down during its flushing cycle.
“So finally we brought a plumber in and they checked out our well and our well was like almost dry,” Italiano said.
She could not recall the well's depth but said it was not especially deep. She said they had lived there for about 20 years without a water-supply problem like this. The household turned off the water system's automatic flushing cycle and sharply cut its water use.
“We mastered the minute and a half showers,” she said.
Even the water collected outside for the gardens offered little relief. Italiano had experienced dry spells before, including a difficult year when they were pasturing cows. This felt different.
“Last summer just went on for two months or something.”
The worry reached into the house concerts they host, where an evening's visitors could mean dozens more people using the water.
“So, you know, we have like 50 people, and I was telling people, don't flush the toilet.”
Her experience was one household's version of a much wider emergency.
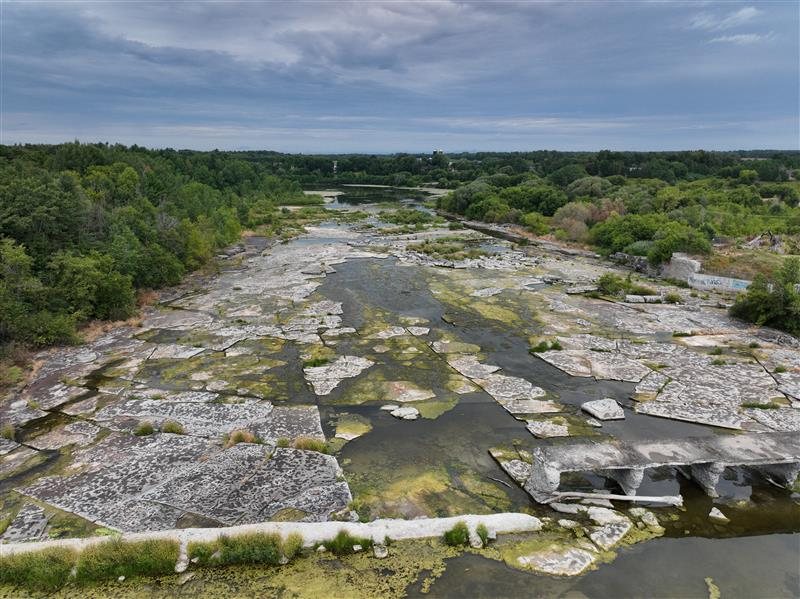
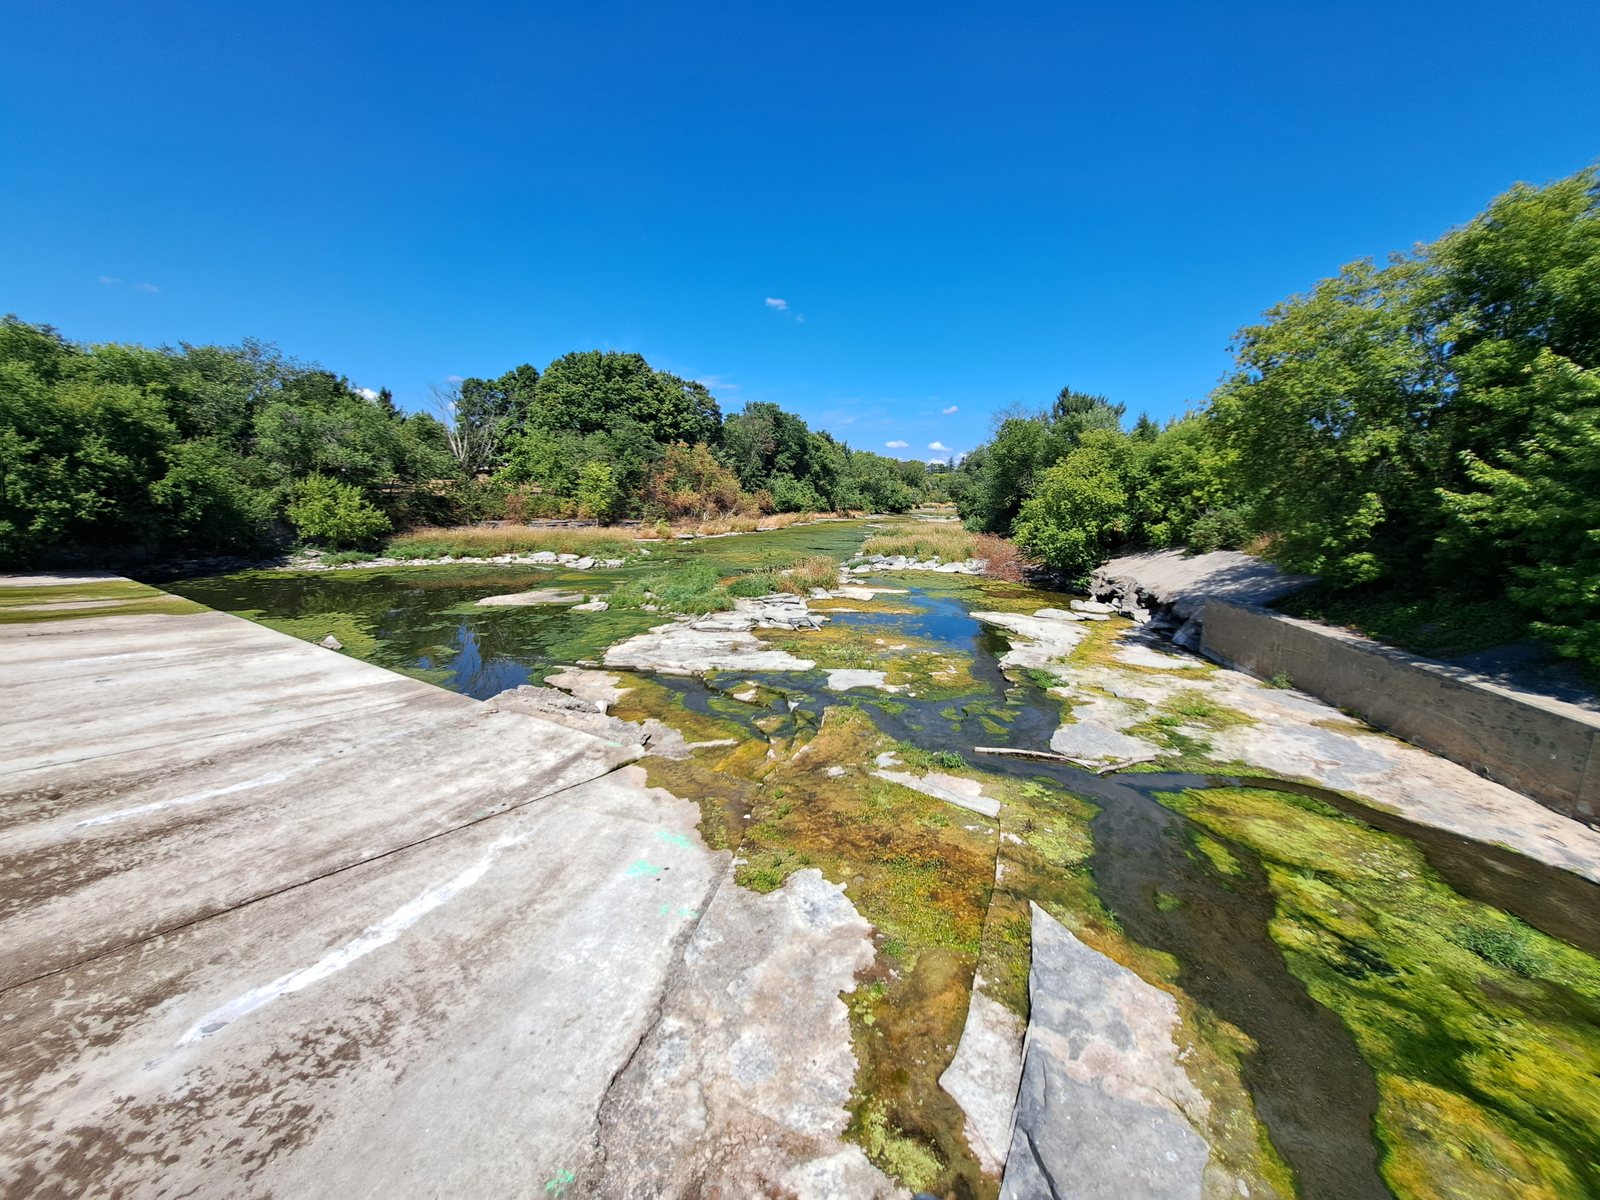
Kat Watson, South Nation Conservation's coordinator of early warning systems and watershed plans, said the watershed reached Level 3, or severe drought, by the end of August 2025. At some gauges September brought only about 17 to 20 millimetres of rain compared with a usual 80 to 90.
“We saw that drought really persist,” Watson said.
Relief did not arrive everywhere as soon as rain did. Dry conditions continued into October, with rainfall finally helping toward the end of that month and into November.
“The impacts were so severe on groundwater levels it took a little while for some of those levels to recover.”
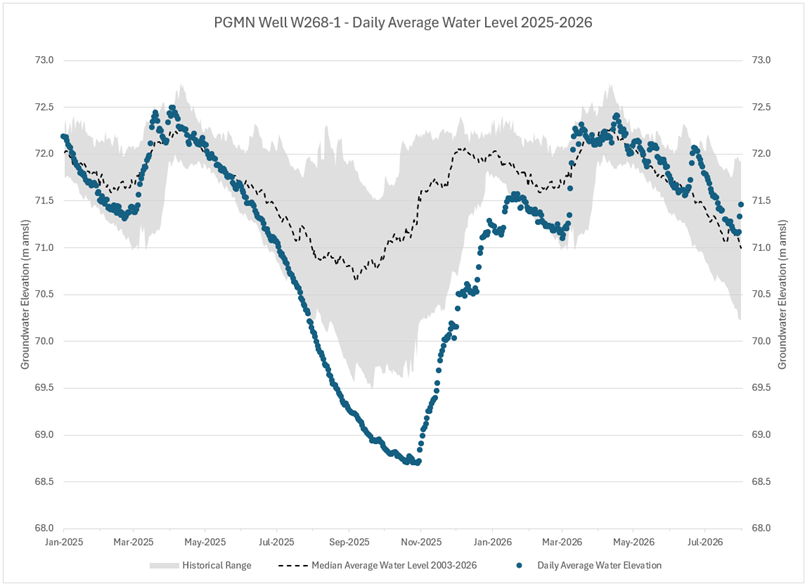
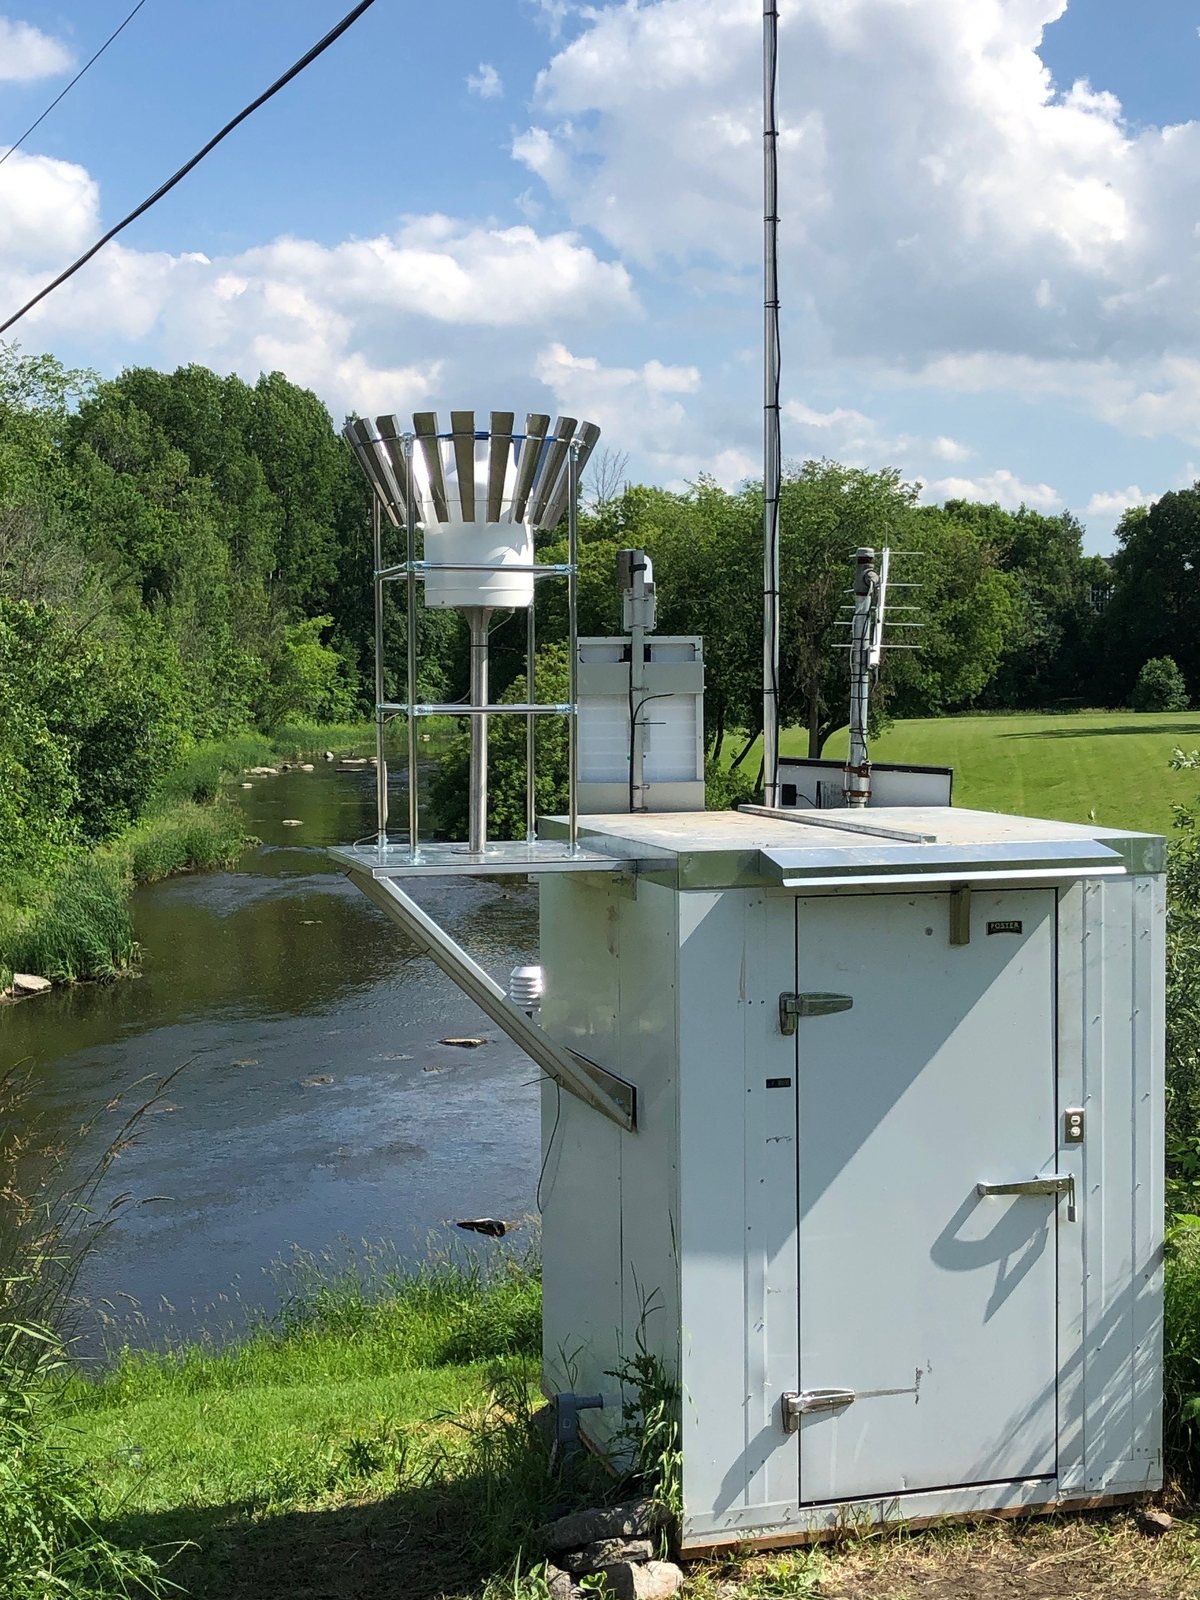
SNC tracks water levels, river flows and precipitation totals daily. Some monitoring stations recorded some of their lowest levels on record. SNC's groundwater records go back to the early 2000s, while some river records extend to the 1970s.
“Even right into the fall we were kind of really still pretty worried,” said Italiano. “Actually we still haven't even hooked up our system that flushes.”
Watson said SNC heard from residents who had lived in their homes for 30 or 40 years without running out of water before encountering supply problems.
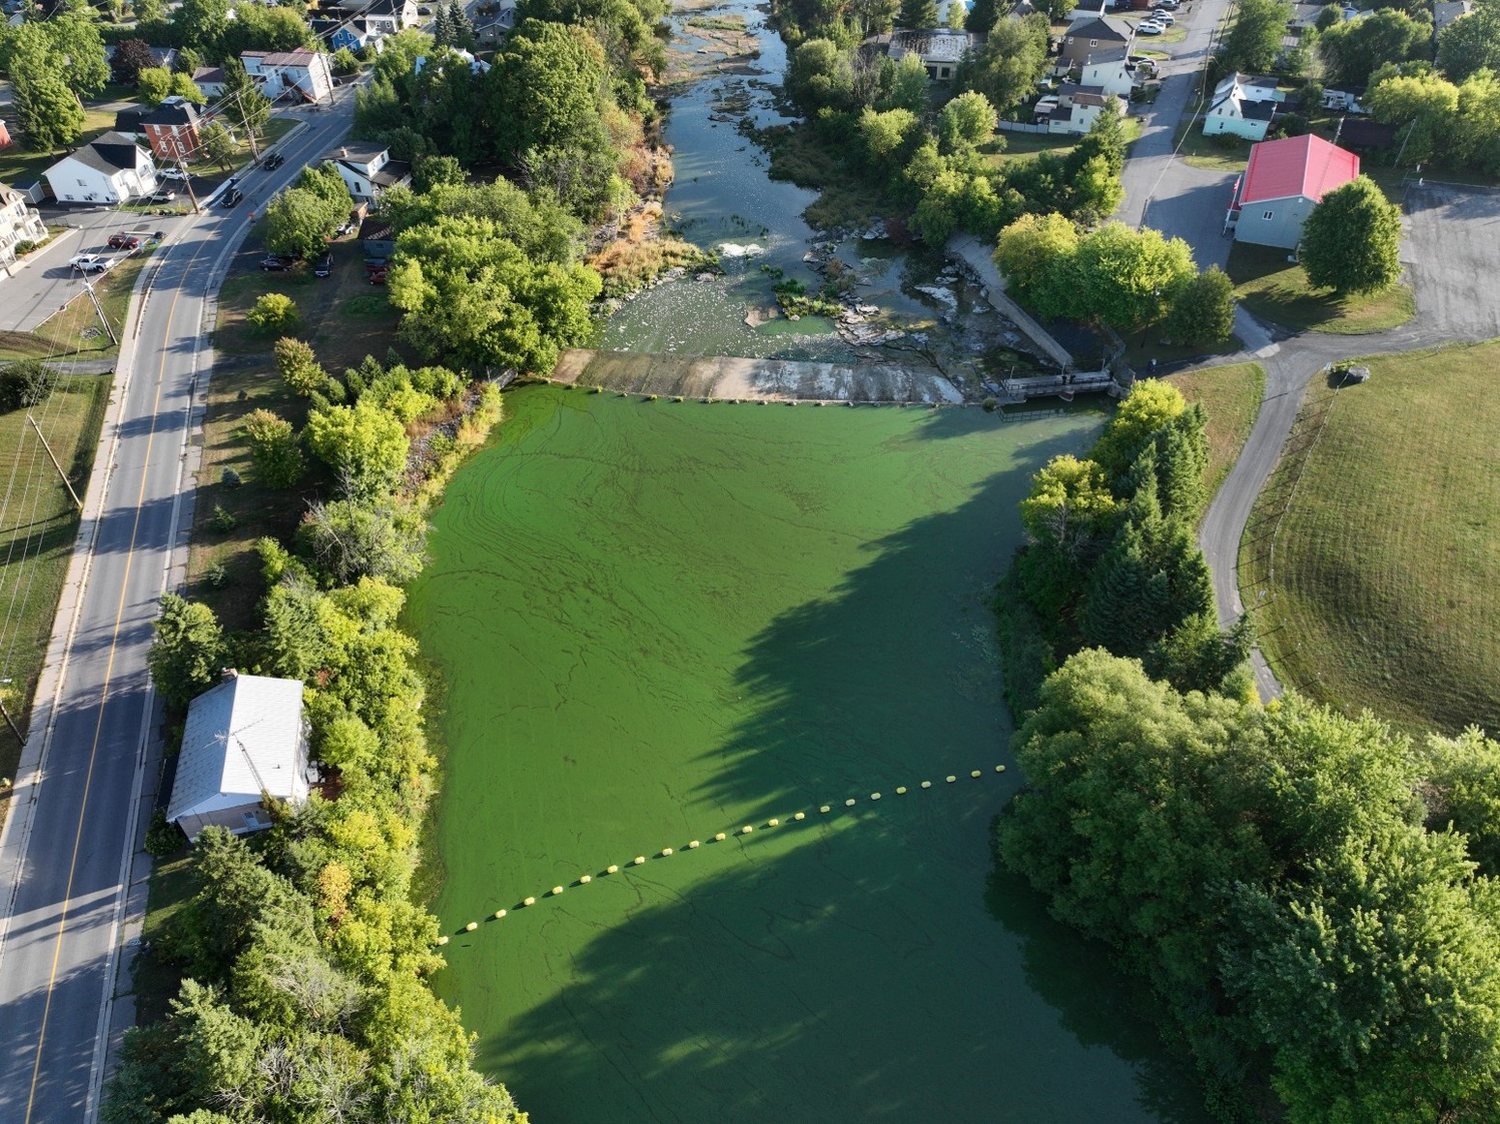
The damage extended beyond household taps. Watson described reduced crop productivity, difficulties supplying livestock and sections of small headwater streams drying up. A severe harmful algae bloom also developed on the South Nation River.
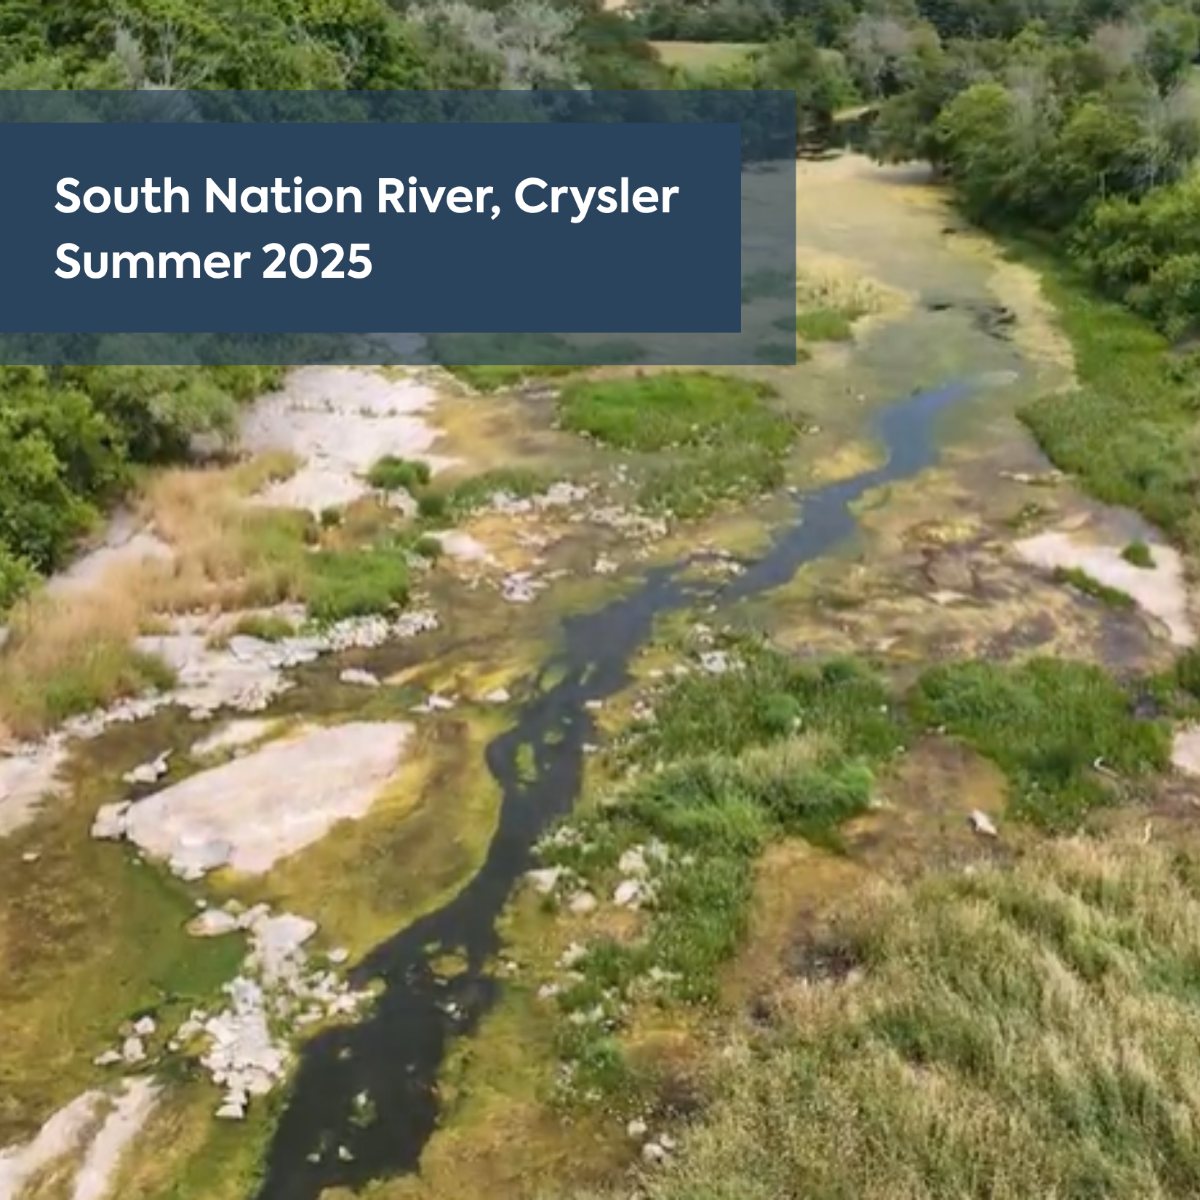
Blue-green algae, or cyanobacteria, can multiply rapidly in warm, slow-moving river water when nutrients such as phosphorus and nitrogen are available. These nutrients can reach waterways through runoff from farm fields carrying fertilizer, manure or soil, as well as septic systems, urban runoff and discharges from wastewater treatment plants. Treatment can reduce nutrient levels but does not necessarily remove them completely. Some cyanobacteria produce toxins that can make people and animals sick through exposure to contaminated water. Health Canada warns that a bloom’s appearance cannot tell people whether toxins are present.
“It was definitely the worst drought that I'd seen,” Watson said, describing her experience over 22 years working for conservation authorities.
Then came another reversal.
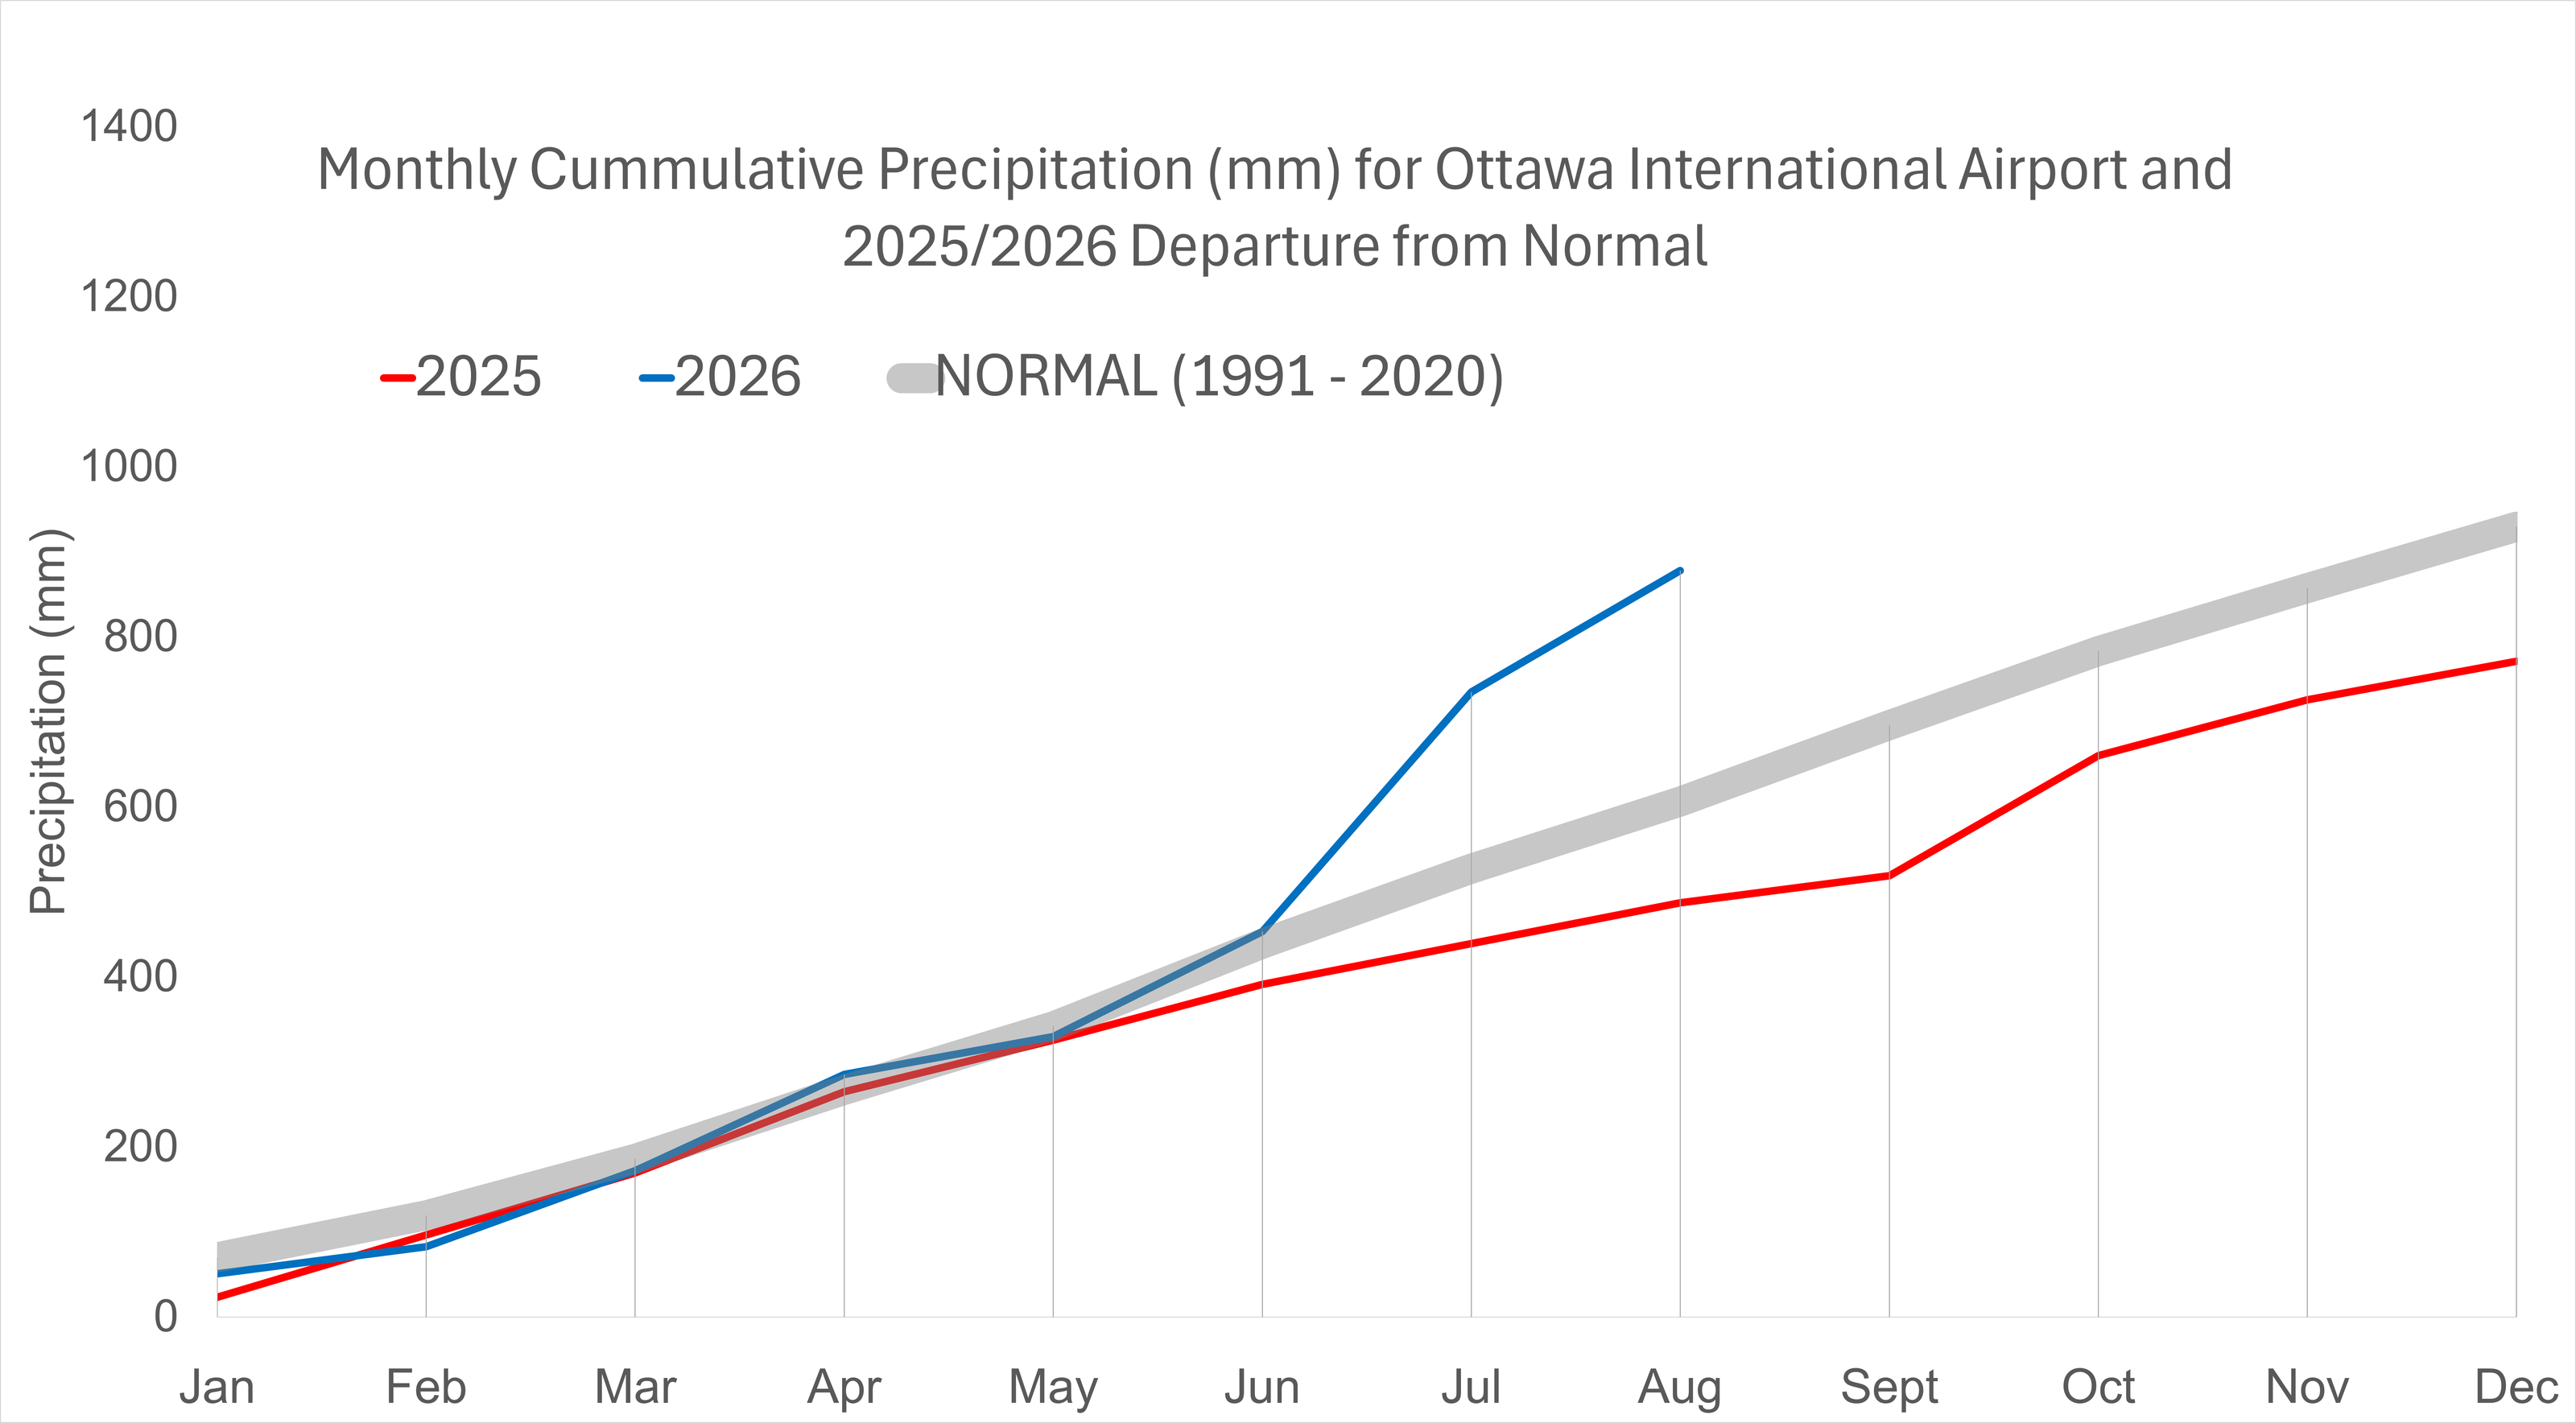
Watson described unusually wet summers in 2024 and 2026 on either side of the dry summer of 2025. For Italiano the wet weather brought a different kind of garden loss.
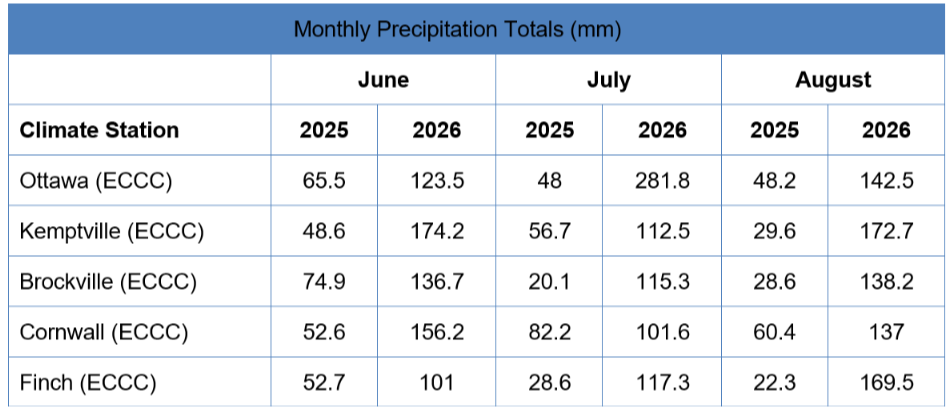
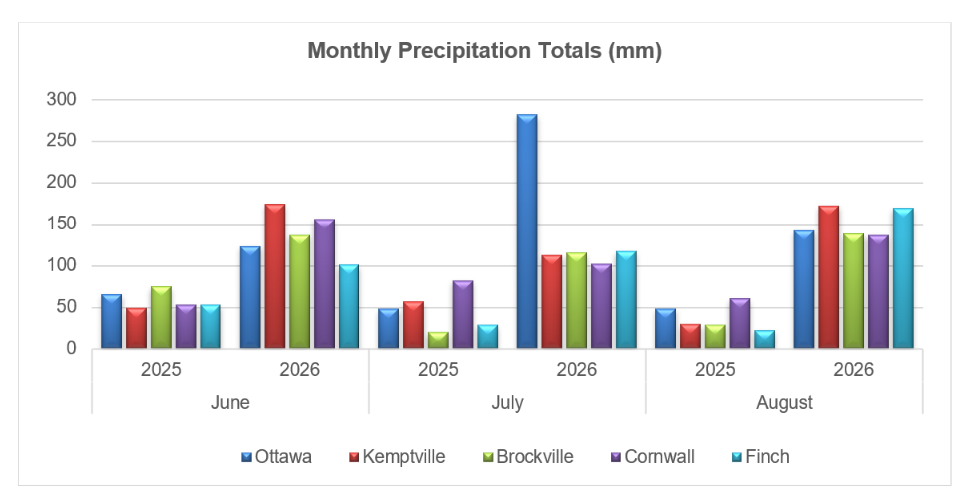
“We had the total opposite problem where we had everything in our gardens rotting because it was so wet,” Italiano said. “We had no tomatoes, no beans.”
Watson cautioned that SNC had not conducted a study establishing climate change as the cause of this particular event. But she said these events are becoming more extreme.
Ontario research illustrates why the answer is more complicated than counting rainfall. A 2019 modelling study of the Grand River watershed found different groundwater outcomes under wetter and drier future climate scenarios, with local geology affecting the response.
A separate study of exposed bedrock in the Tay watershed near Perth found that ice could impede groundwater replenishment from winter rain and snowmelt. At that site, water arriving at the surface did not always replenish the groundwater below.
Neither study predicts when Italiano's well or any Russell well might struggle again. They point instead to the importance of local conditions and how water replenishes the ground not simply whether a year is labelled wet or dry.
Canada's Changing Climate Report 2026, a federal-led assessment of research projects longer, more frequent and more intense summer drought affecting rainfall and agricultural soils across central and southern Canada particularly later this century under higher warming.
The assessment also expects groundwater replenishment to shift earlier as snow melts sooner and more winter precipitation falls as rain. Shallow groundwater systems can respond more quickly to changing conditions than deeper ones, and groundwater stored in aquifers can offer more protection from drought than surface water provided pumping does not increase markedly. Aquifers are layers of permeable rock or sediment that store and transmit groundwater.
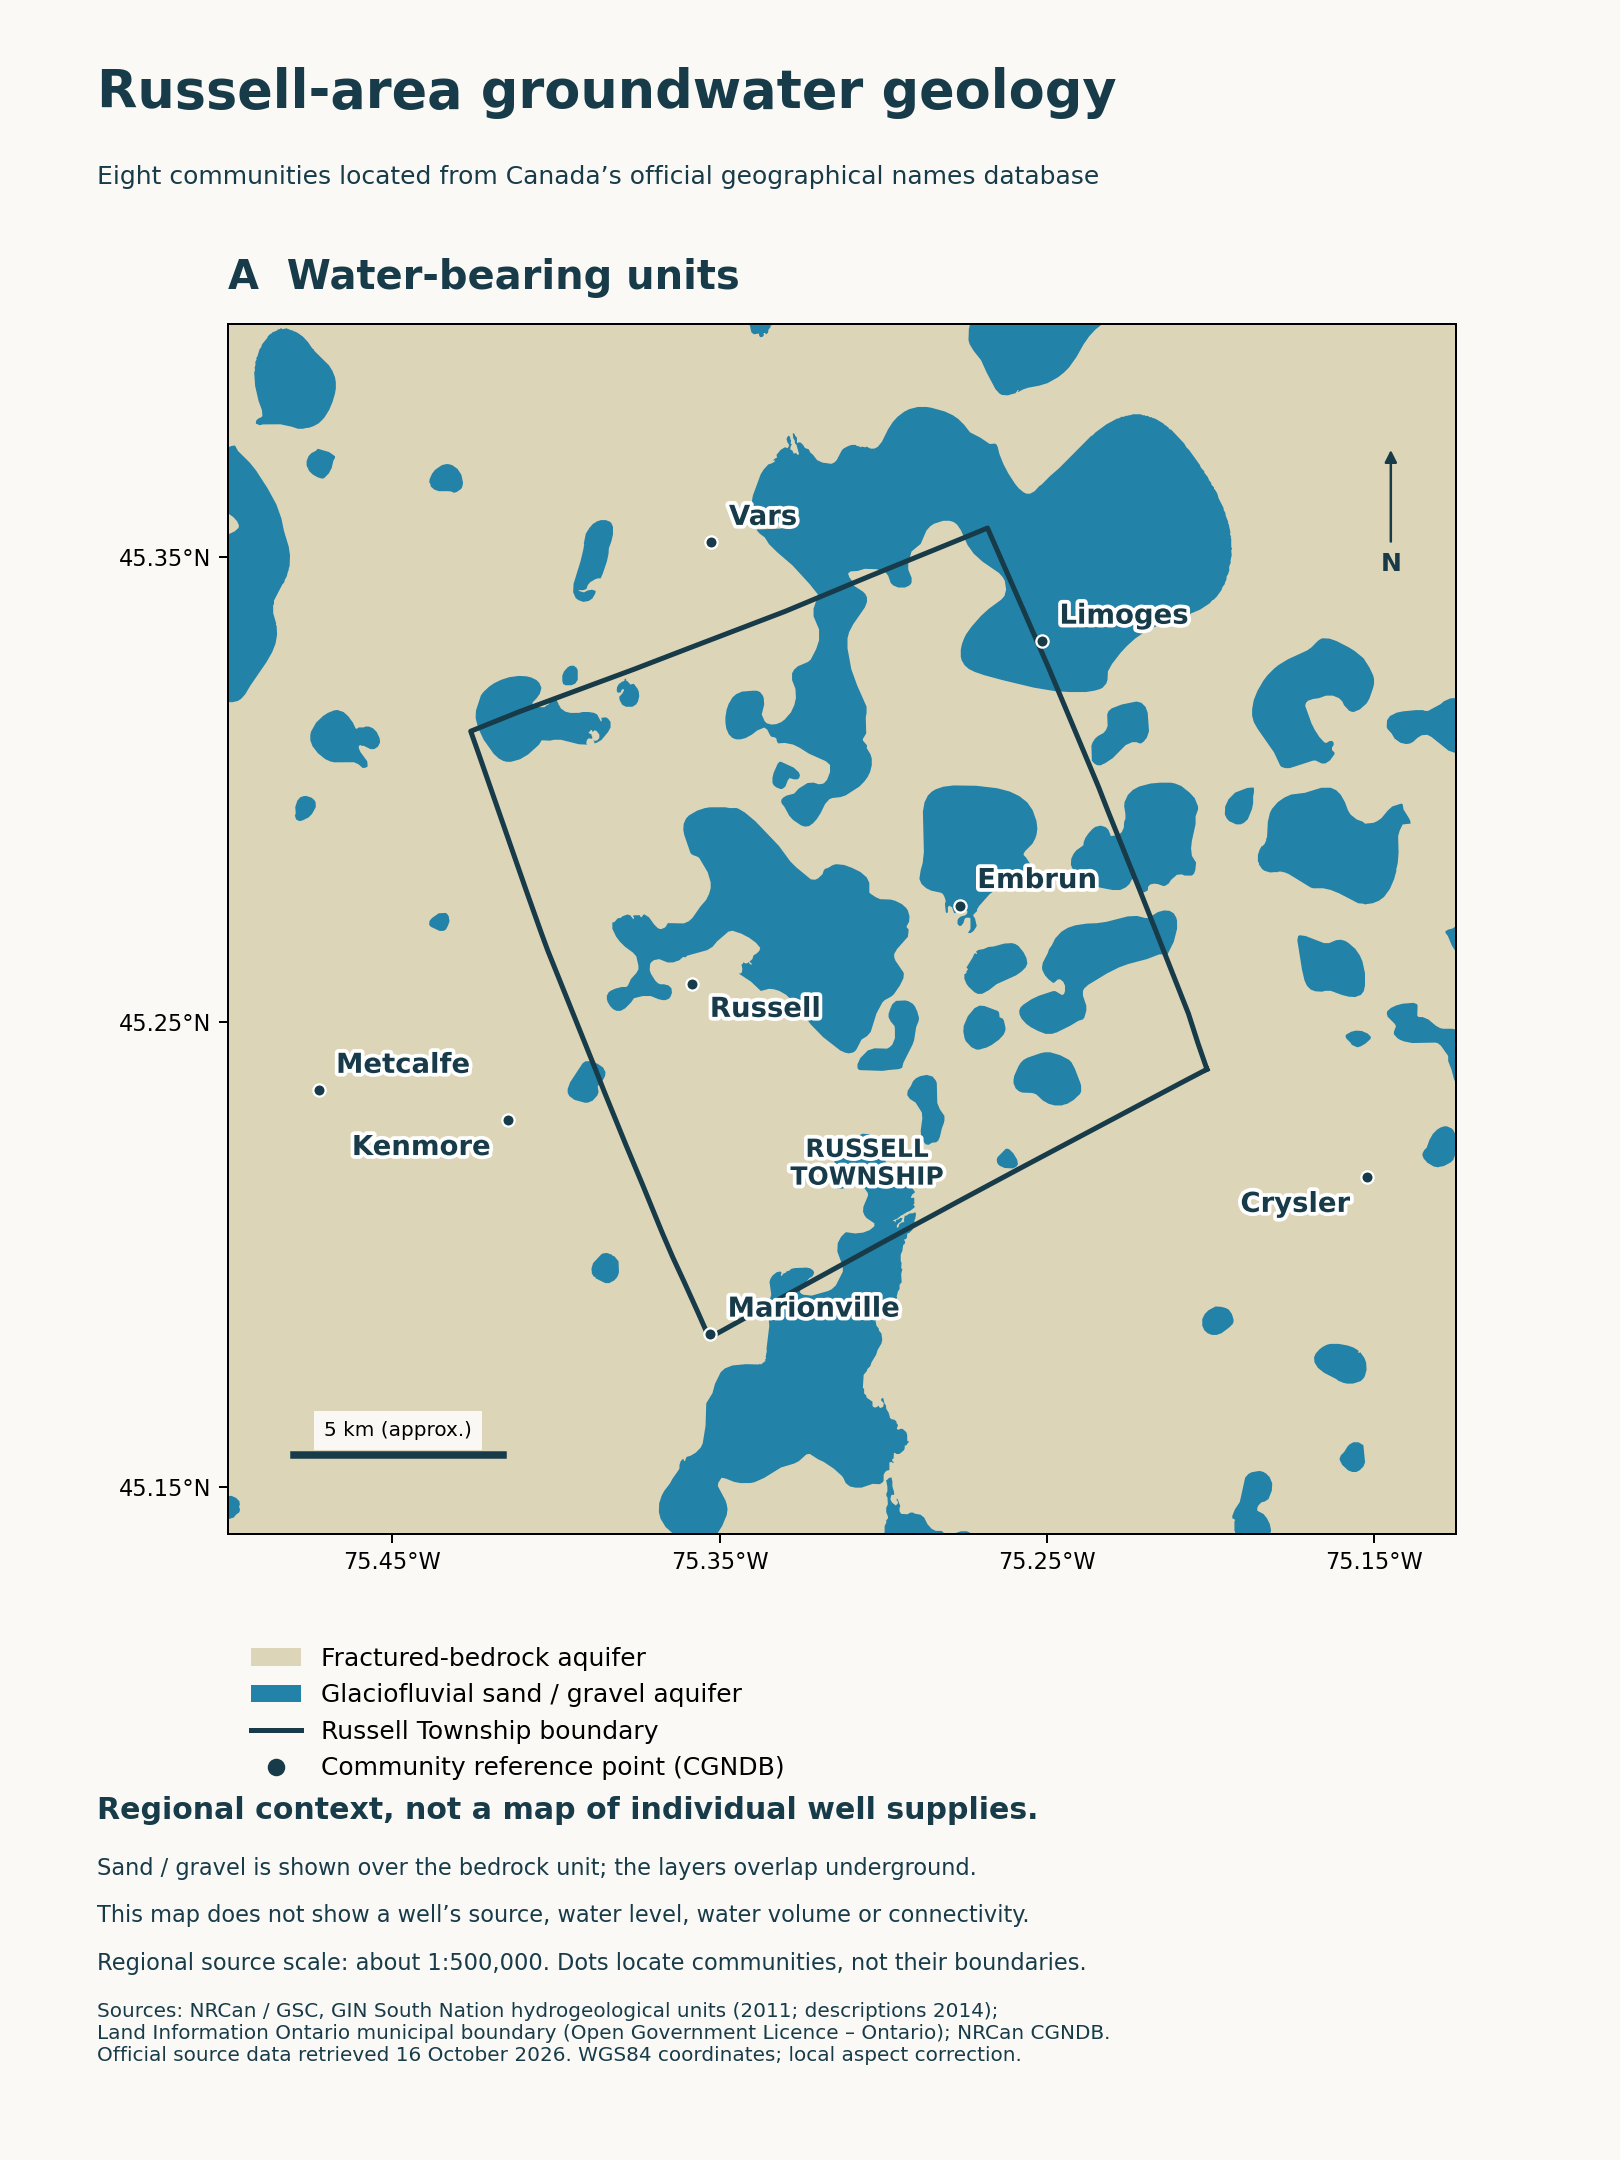
Italiano said the township should pay closer attention to water use when approving large agricultural facilities. She said neighbours had formed a committee to raise concerns with the municipality.
Italiano said her well seemed to be doing all right at the moment but the experience has changed her confidence in a supply she once took for granted.
“It was quite shocking that this happened now,” she said. The fear of another shortage remains.
“I think it is a new thing but it's going to keep happening for sure.”