Local democracy: What the 2026 election reveals about Russell and eastern Ontario
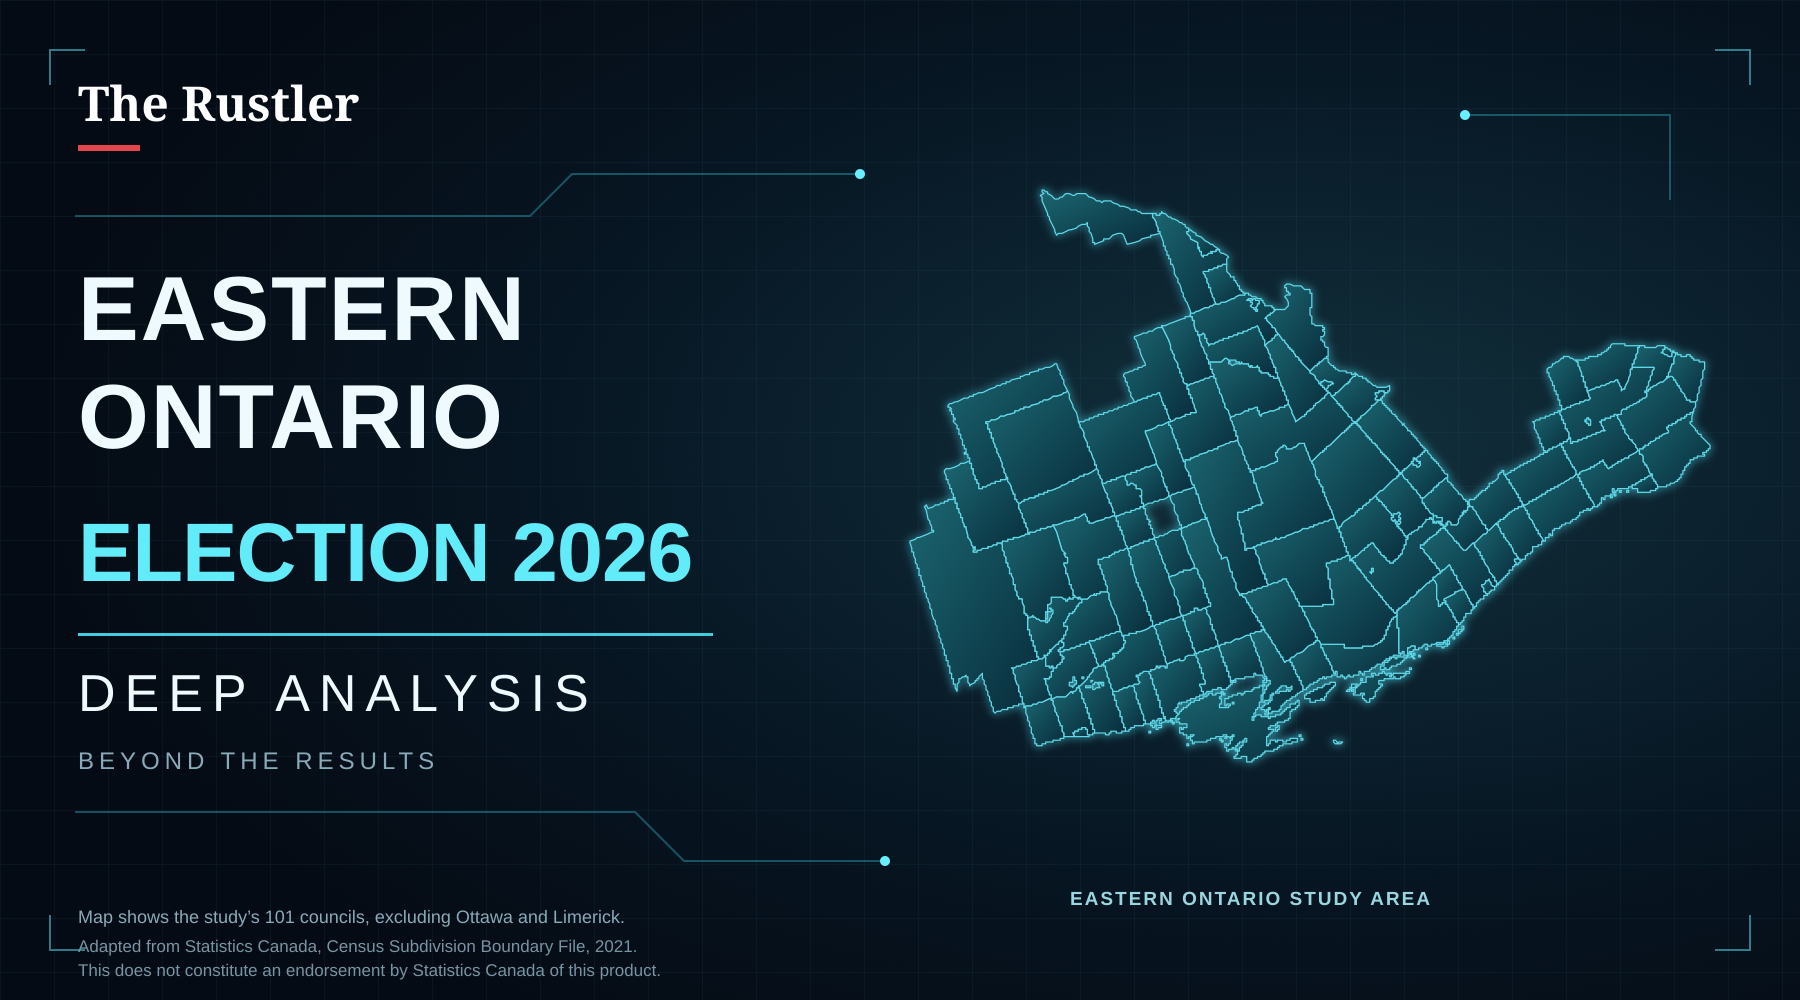
The Rustler has conducted an extensive review of voting patterns and council election results across 101 municipalities in eastern Ontario comparing them with the region’s population, age, income, education, language and rural and urban communities to identify major trends in local democracy.*
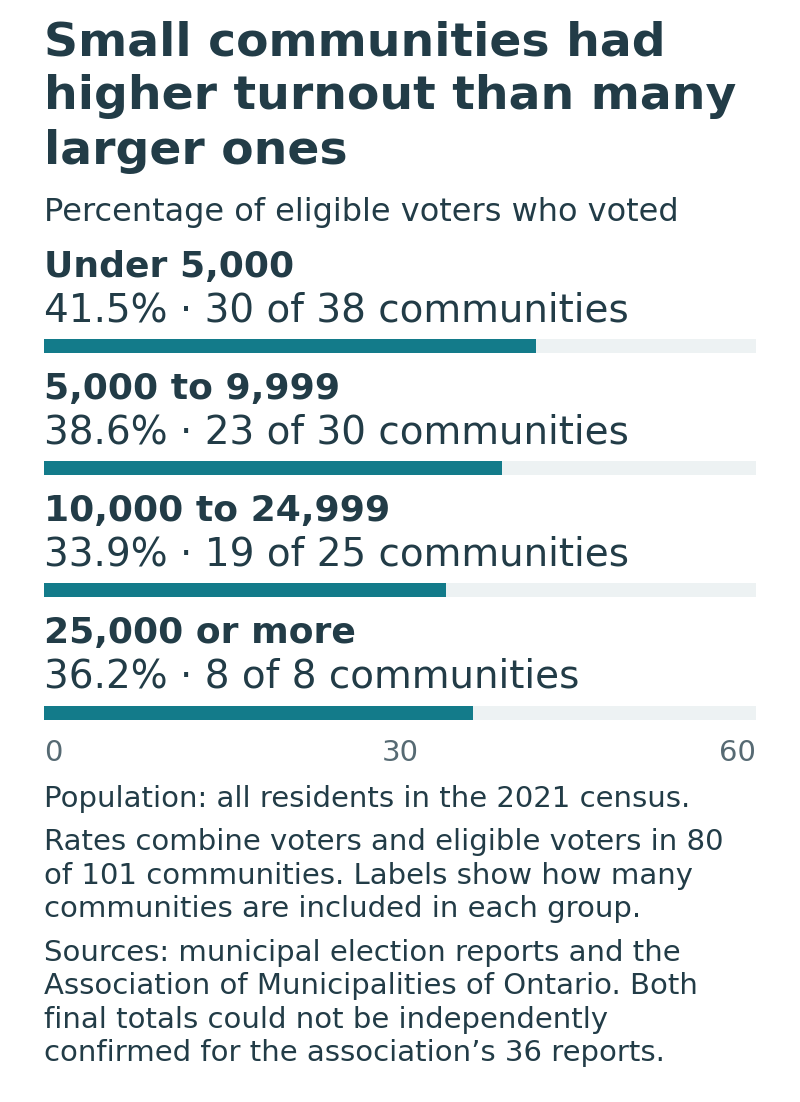
The smallest communities had higher turnout than many larger ones. In municipalities with fewer than 5,000 residents, 41.5 per cent of eligible voters participated, compared with 33.9 per cent in communities with 10,000 to 24,999 residents. The largest communities fell between them at 36.2 per cent.
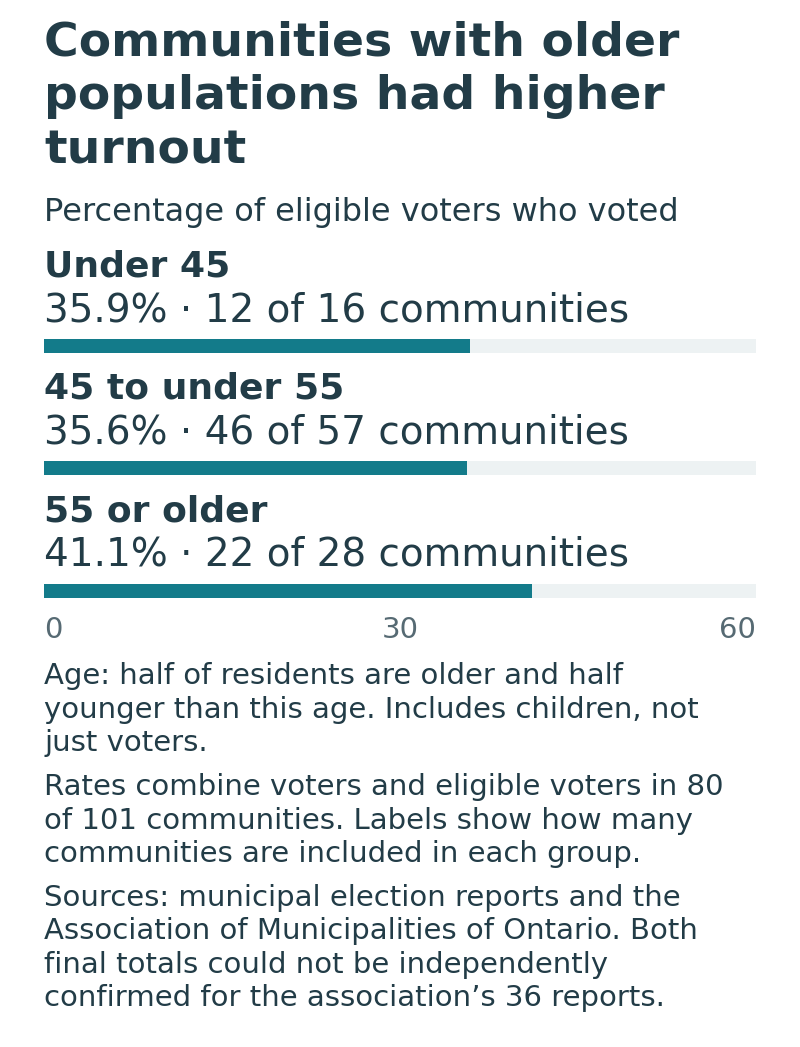
Communities with older populations also had higher turnout. Where the median age was 55 or older, turnout was 41.1 per cent. That compared with 35.6 per cent where the median age was 45 to under 55 and 35.9 per cent where it was under 45. These figures describe the ages of residents, not the ages of the people who voted.
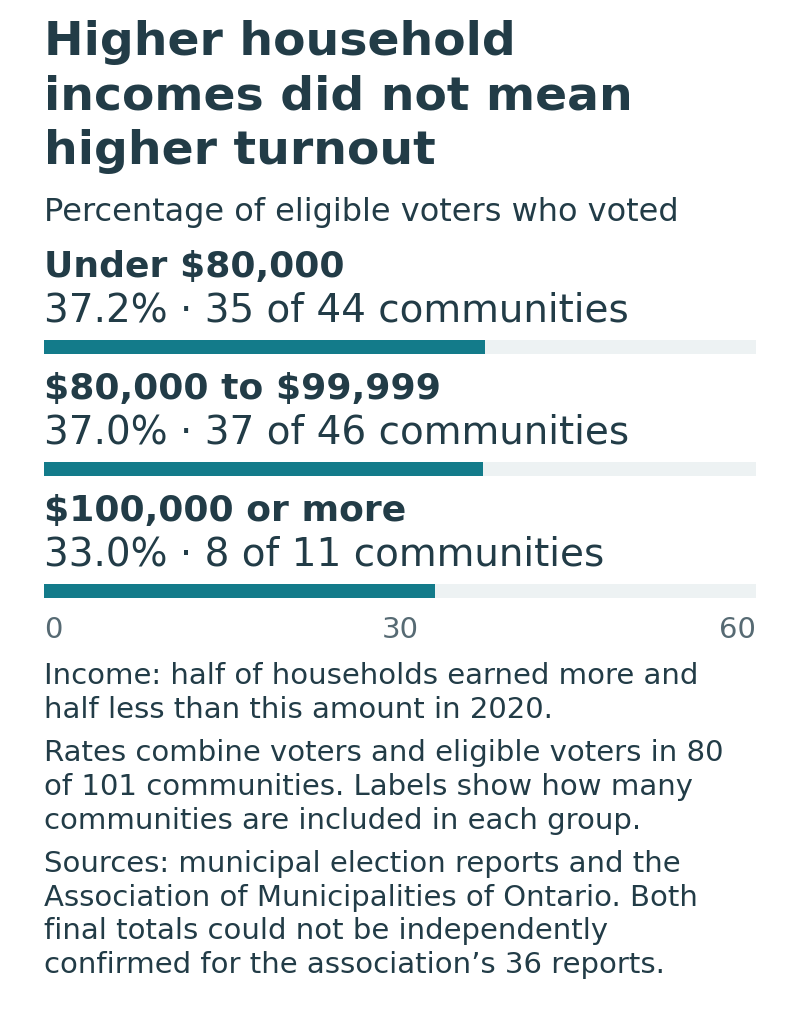
Higher household incomes did not go with higher turnout. Communities with median household incomes of at least $100,000 recorded turnout of 33 per cent, compared with 37.2 per cent in communities below $80,000. The income figures describe households in 2020 and not the incomes of individual voters in 2026.
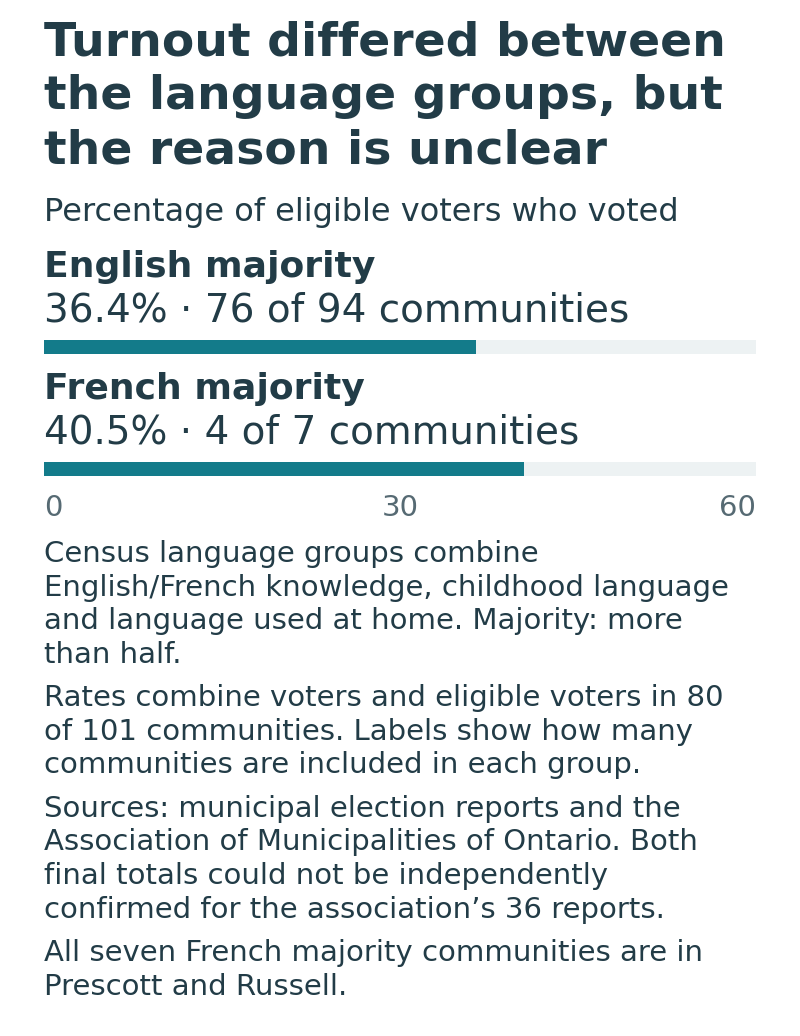
Turnout was 40.5 per cent in the four French majority municipalities with usable figures* compared with 36.4 per cent in 76 English majority municipalities. Figures from three French majority and 18 English majority municipalities were left out because they were missing or could not be reliably compared.
The language comparisons did not give a clear answer about whether language played a part in the election results. All seven French majority communities in the study are in Prescott and Russell and only four had usable turnout figures. That makes it difficult to tell whether the differences were connected to language or to other things about those particular communities.
The rural picture was less straightforward. Council seats were more often filled without a contest in communities where most residents lived in rural areas, even when communities of similar size were compared. Among the 80 municipalities with usable turnout figures 37.2 per cent of eligible voters cast ballots in communities where most residents lived in rural areas compared with 36 per cent elsewhere.
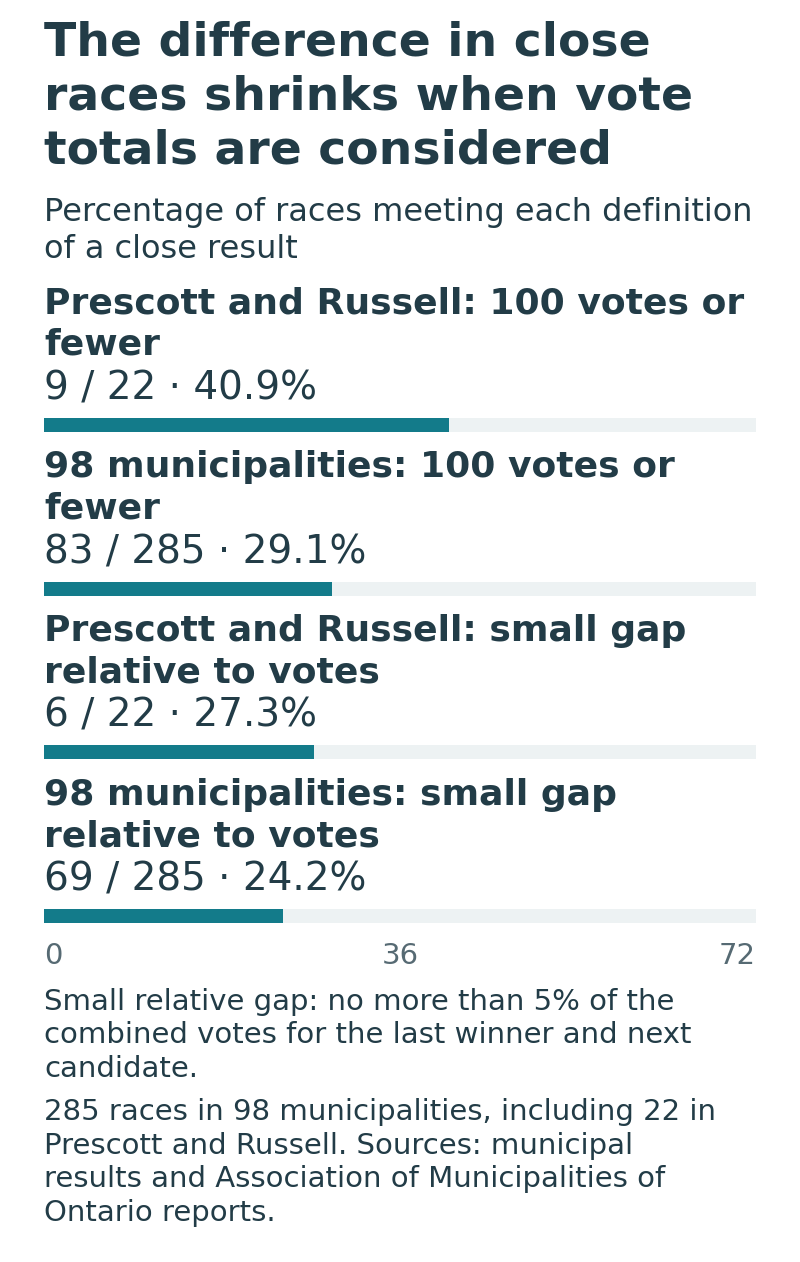
The way a close race is measured also changes the picture. Races decided by 100 votes or fewer accounted for 40.9 per cent of contests in Prescott and Russell compared with 29.1 per cent across the wider study. When a close race meant a gap no larger than five per cent of the two candidates’ combined votes the figures were much closer with 27.3 per cent in the counties and 24.2 per cent across the study. The two candidates are the last person elected and the person who finished next.
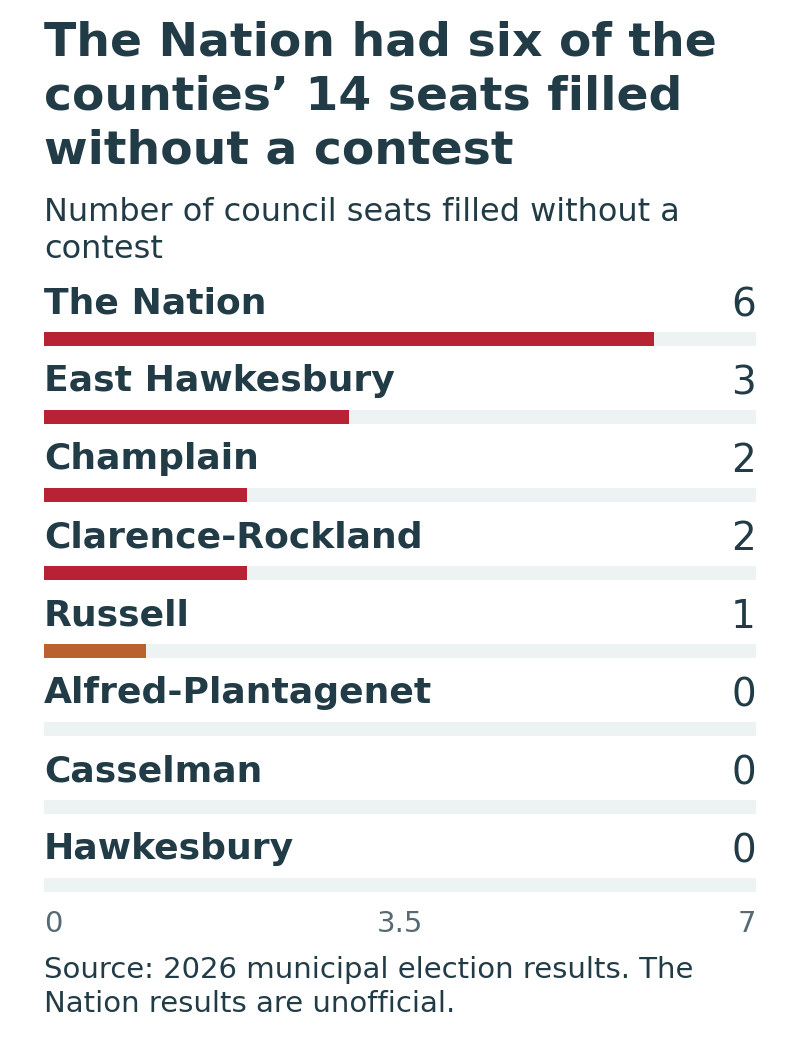
Across the counties’ eight municipalities, 26.9 per cent of council seats were filled without a contest compared with 16.5 per cent across the 101 municipalities studied. The Nation accounted for six of the counties’ acclamations and East Hawkesbury for three.
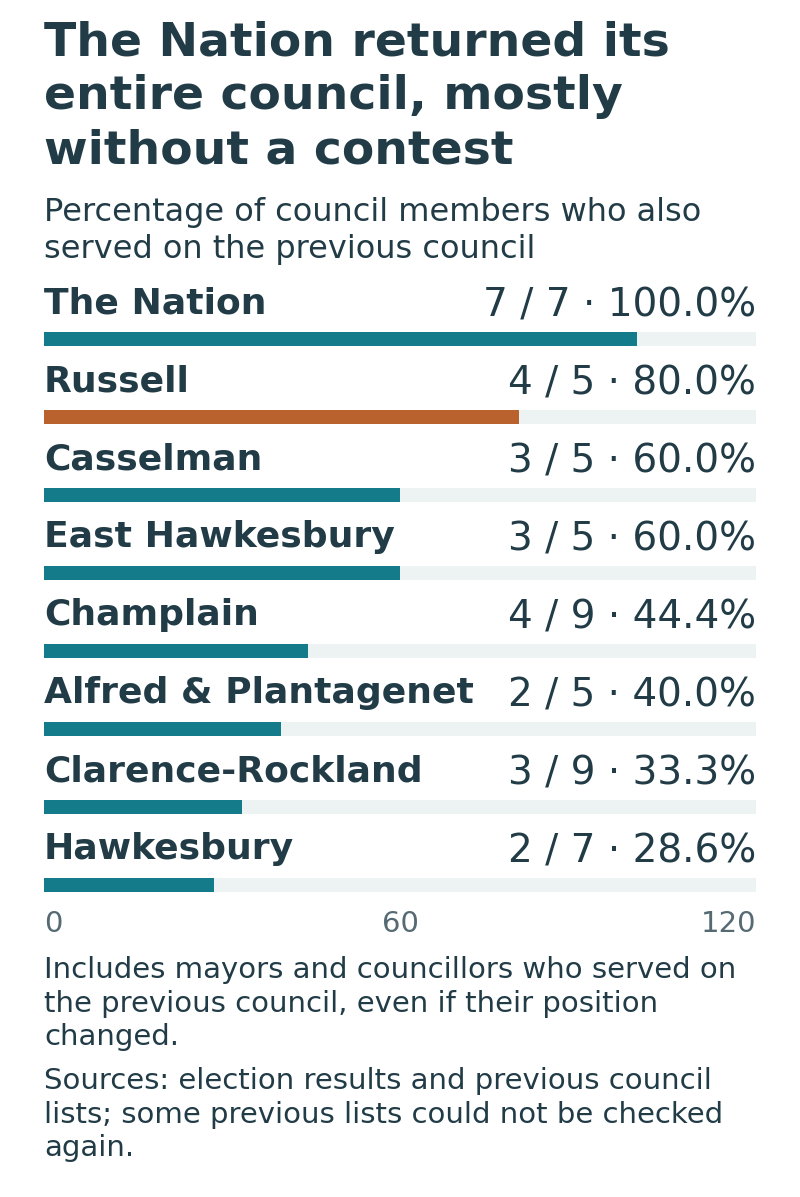
28 of the counties’ 52 incoming council members served on their municipality’s outgoing council, while 24 did not. The Nation returned all seven members, although six were acclaimed. Its result accounted for much of the apparent difference in returning members between predominantly rural municipalities and the other county communities.
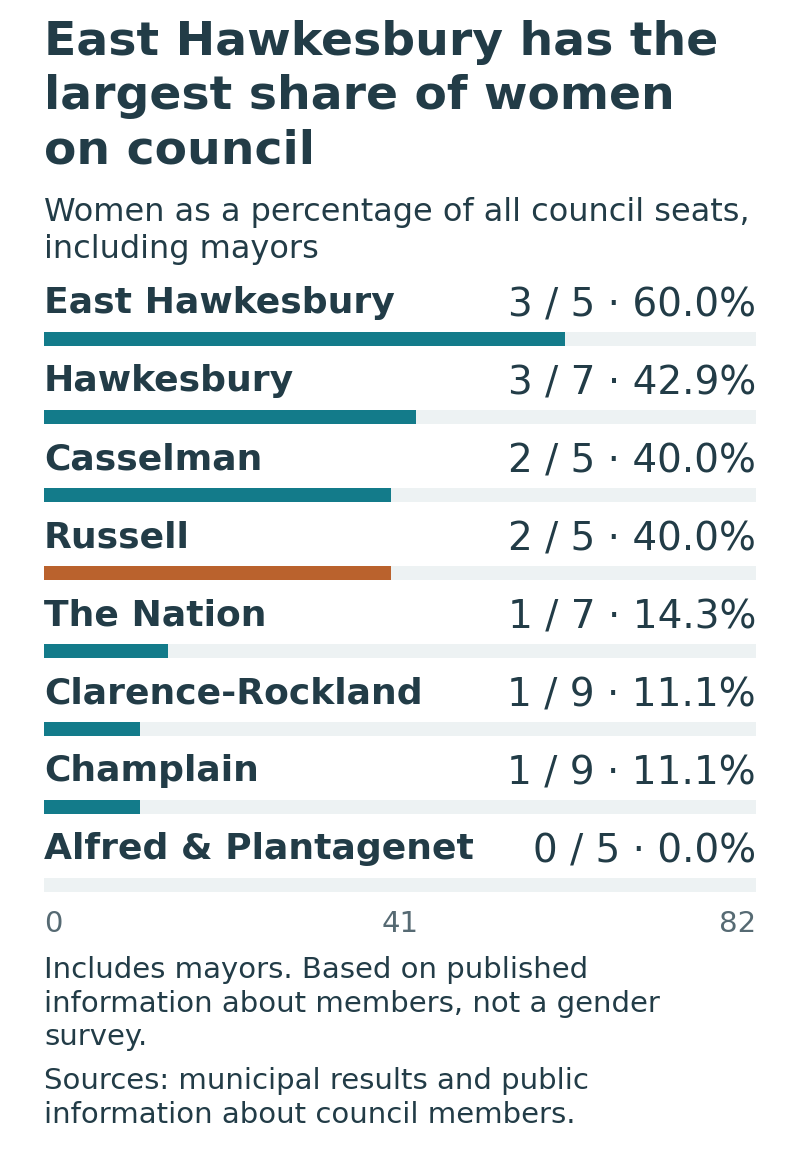
Women will hold 13 of the counties’ 52 seats or 25 per cent. East Hawkesbury has the highest proportion among the eight municipalities with women holding three of its five seats.
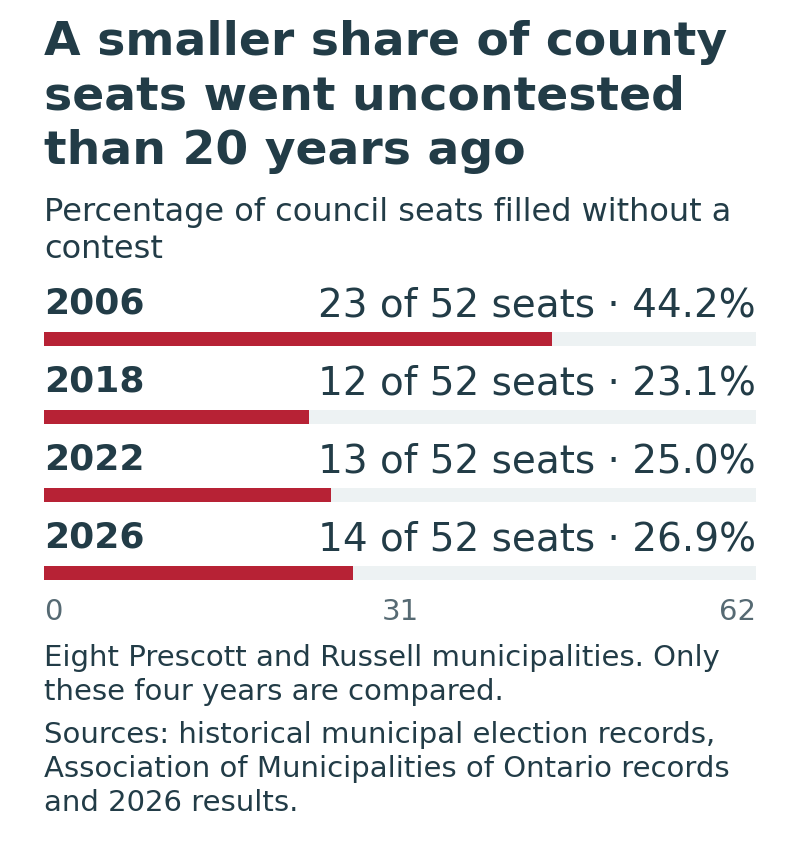
The longer view offers another contrast. The counties had 23 acclaimed seats in 2006 compared with 14 this year. Although acclamations increased by one in each of the last two elections a larger share of seats went uncontested 20 years ago compared with now.
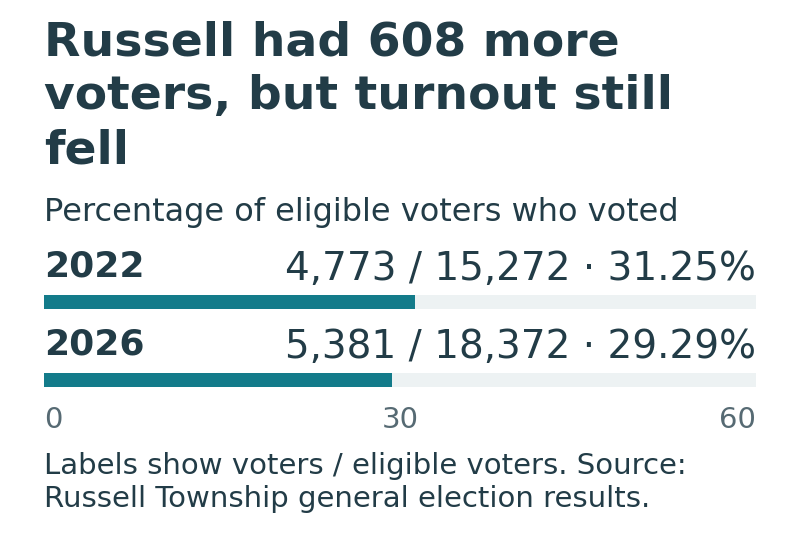
Russell attracted 608 more voters than in 2022 despite having only four candidates still campaigning in what some people might have thought was an acclamation after candidate Nick Gallagher dropped out of the race but was still technically on the ballot. Seven candidates competed for the four councillor seats in 2022.
The number of eligible voters grew faster than the number who cast ballots bringing turnout down from 31.25 per cent in 2022 to 29.29 per cent this year. Russell’s mayor was acclaimed in both elections.
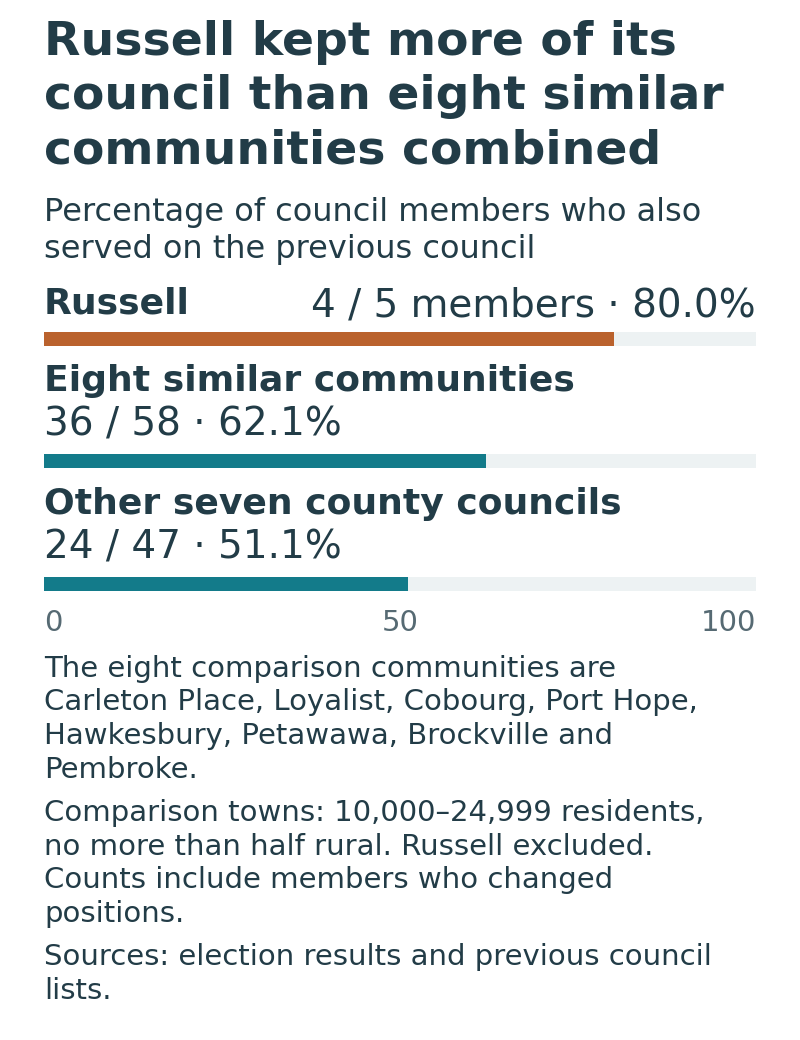
Russell returned four of its five council members, or 80 per cent. Across eight similarly sized communities with comparable rural and urban settlement patterns, 36 of 58 members returned, or about 62 per cent.
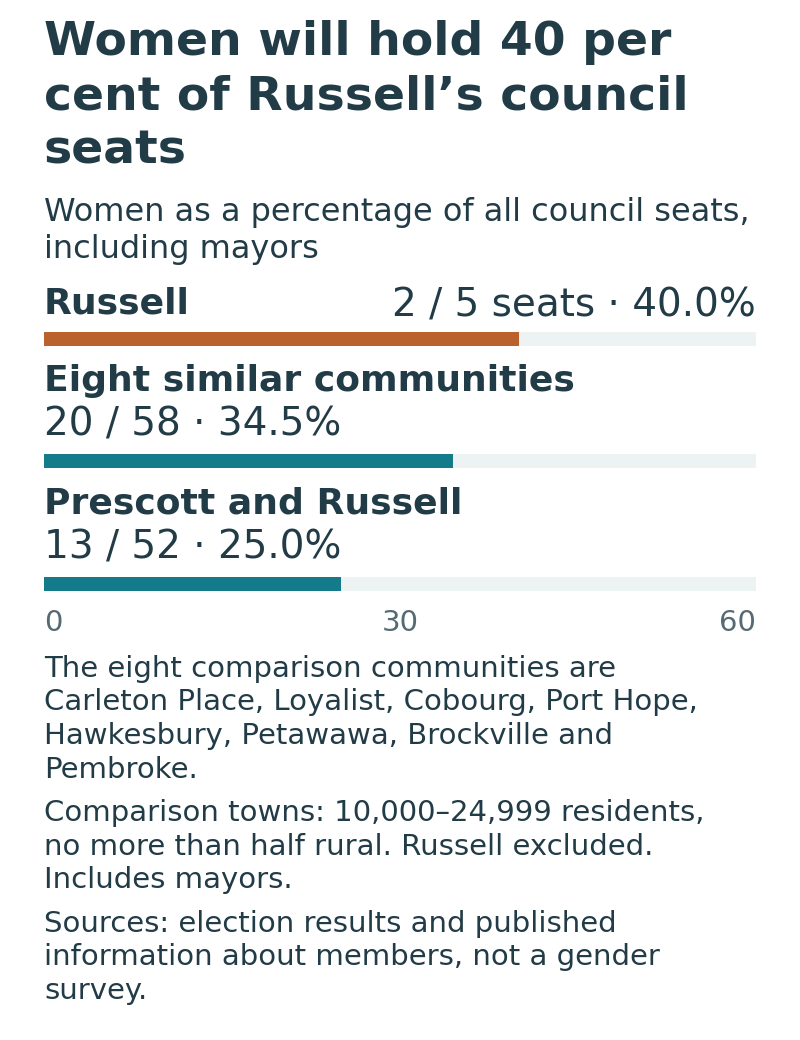
Dominique Bertrand and Lisa Deacon won two of Russell’s four councillor seats. Including Mayor Mike Tarnowski, women will hold 40 per cent of the incoming council’s seats. That is above the counties’ 25 per cent but closer to the 34.5 per cent among those eight comparable communities.
On election night township officials said this was the first time two women had been elected at the same time. Two women have served together before: Amanda Simard, elected in 2014, and Cindy Saucier, appointed in January 2015. Township clerk Joanne Camiré Laflamme says that to her recollection this is the first time since at least 1988 that two women have been elected together to begin a new council term.
Tarnowski’s acclamation filled one of Russell’s five seats without a contest, or 20 per cent. Among the eight other communities in the comparison group four of 58 council seats were filled without a contest, or 6.9 per cent.
Russell also stands out in the community figures used to make these comparisons. Its median household total income of $123,000 was the highest in Prescott and Russell and second in the wider study, behind Beckwith at $126,000. These figures describe income in 2020.
In the 2021 census 84 per cent of Russell households owned their homes compared with 77.3 per cent across the counties and 74.3 per cent across the study area. Among residents aged 25 to 64 29.3 per cent held a bachelor’s degree or higher compared with 20.7 per cent across the counties and 20.9 per cent across the study area.
All 54 municipalities in the study where at least 85 per cent of households owned their homes also had most of their residents living in rural areas.
Together, these comparisons show who holds office, how much choice voters had and how much their councils changed. They help identify differences between communities without claiming to explain why individual people voted as they did.
Correction: This story has been updated after a further check of municipal election records. Some turnout figures and the number of communities included in those comparisons have changed. The main patterns remain the same.
* The turnout comparison includes 80 with usable figures: both the number of people who voted and the number eligible to vote, without an unresolved conflict that would make the comparison unreliable. Municipal records supplied the figures for 44 communities and municipal reports published by the Association of Municipalities of Ontario supplied the other 36. For the 36 municipal reports published by AMO, we could not independently confirm both the voter and eligible voter totals against each municipality’s final records.